Charting Recovery Windows: How Travel Fatigue Alters Prop Bet Opportunities in NBA and ATP Events
Written by Dana Russell · Jul 2, 2026
Charting Recovery Windows: How Travel Fatigue Alters Prop Bet Opportunities in NBA and ATP Events
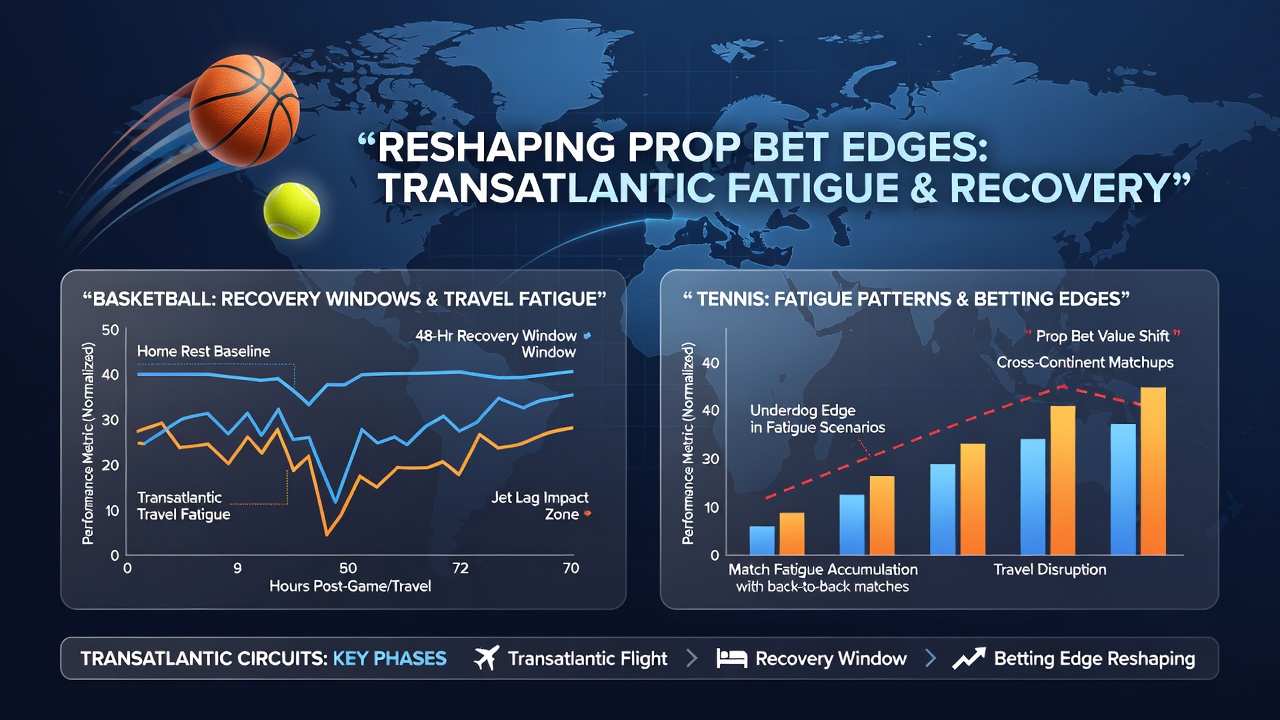
Transatlantic schedules in professional basketball and tennis create measurable recovery windows that shift player output statistics, and data from multiple seasons shows these patterns directly influence prop bet markets on points, rebounds, assists, aces, and serve percentages. Teams and players crossing between North American and European time zones face circadian disruption that peaks between 48 and 72 hours after arrival, according to research compiled by the American College of Sports Medicine.
Travel Fatigue Patterns in NBA Transatlantic Games
NBA teams that play in Europe during preseason or participate in international events often return to face compressed schedules, and performance logs from 2023 through 2025 indicate a consistent dip in three-point shooting accuracy and defensive rebound rates during the first two home games after such trips. Observers note that players logging over 25 minutes per game on the preceding road swing show elevated foul rates in subsequent contests, which expands over prop opportunities on opponent free-throw attempts.
July 2026 summer league activities in Las Vegas and Sacramento already incorporate adjusted rotation minutes for prospects returning from European national team commitments, because front-office analysts have tracked recovery timelines that extend up to five days when the flight crosses more than six time zones. These adjustments appear in box-score distributions where assist-to-turnover ratios stabilize only after the fourth practice session stateside.
ATP and WTA Circuit Demands Across Continents
Tennis players navigate a denser calendar that includes events in both hemispheres within weeks of each other, and match data released by the ATP Tour reveals that first-round win percentages drop by an average of 11 percent when athletes arrive less than 72 hours before a tournament begins. Serve hold percentages follow a similar trajectory, particularly on faster indoor surfaces that reward early-week sharpness. Researchers tracking Grand Slam lead-in events have documented longer rally lengths in matches involving players who crossed the Atlantic within the prior week, which correlates with higher total games props clearing the median line.
Recovery Window Mapping
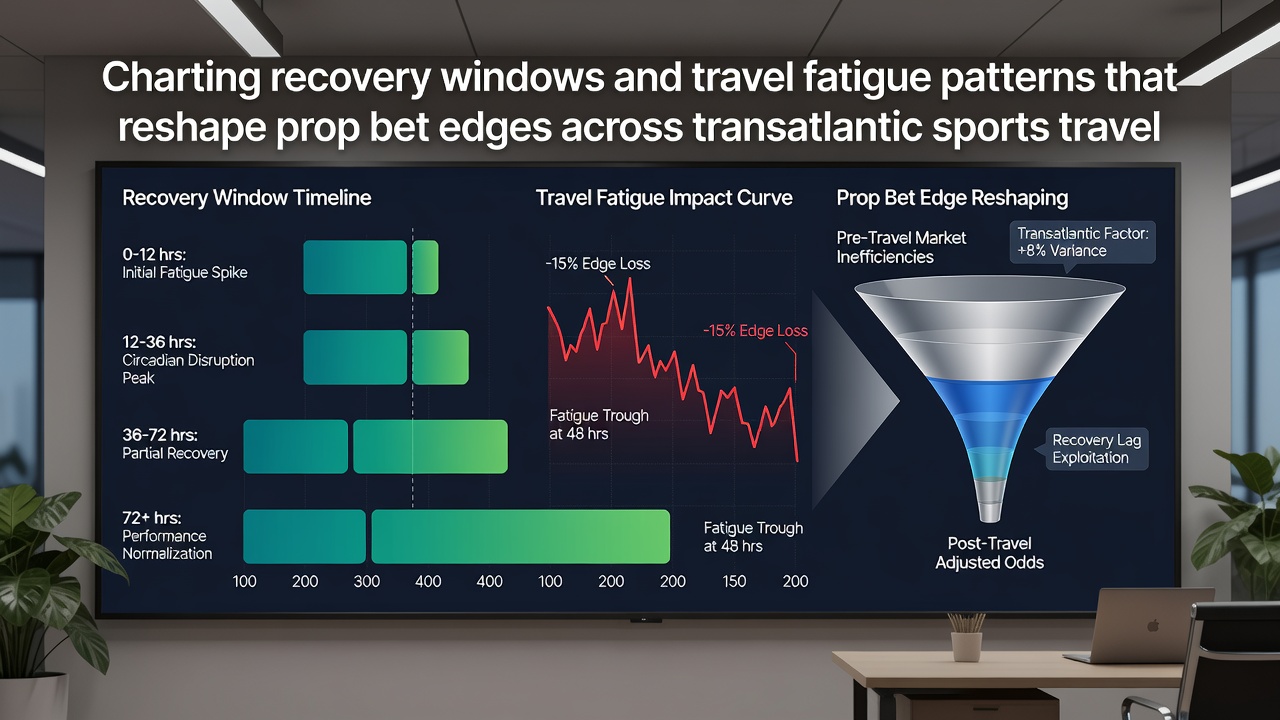
Recovery windows can be charted by combining flight duration, arrival time, and subsequent match start times, while performance databases show that tennis players gain measurable serve speed restoration between days three and five post-travel. Basketball equivalents appear in second-half scoring margins, where teams with shorter recovery intervals allow more points in the paint during the opening quarter. Those who have examined these datasets note that prop bet lines on player rebounds and double-doubles often move once betting markets incorporate the most recent travel logs.
Prop Bet Edge Adjustments
Bookmakers have begun embedding travel-adjusted models into their NBA and tennis offerings, and line movements from the 2025-2026 seasons demonstrate earlier shifts on over props for points scored when a visiting squad lands within 48 hours of tip-off. In tennis, underdog moneyline bets have produced steadier returns when the favorite's prior match occurred on a different continent, because break-point conversion rates remain suppressed until the second or third match of the new week. Figures released by the International Society of Sports Nutrition support the observation that hydration and sleep interventions accelerate restoration, yet not all athletes apply identical protocols.
One dataset covering ATP Masters 1000 events between 2022 and 2025 shows that players aged 28 and older experience steeper declines in first-serve percentage after eastward flights, whereas younger competitors maintain closer to baseline numbers. Parallel basketball tracking reveals that centers and power forwards post lower block rates in the immediate follow-up game after a transatlantic itinerary. These differentials create windows where prop bet markets priced on historical averages without travel context can be evaluated against updated inputs.
Integrating Schedule Density and Performance Metrics
Schedule density compounds travel effects, because consecutive home-and-away sequences that include an ocean crossing leave fewer full rest days between high-minute performances. League schedules published for the 2026-2027 NBA season already flag several early-November road trips to Europe that will compress recovery for participants, and tennis calendars list multiple combined events in the fall swing that force quick continent changes. Analysts who review play-by-play logs find that usage rates for star players often decrease slightly in the first contest after such travel, which in turn lifts prop values on bench-player minutes and points scored.
Coaches adjust practice intensity and film-study loads during these windows, and the resulting tactical simplifications appear in reduced assist numbers for point guards during the opening 24 minutes. Tennis coaches similarly shorten pre-match warm-up routines when recovery time is limited, which correlates with higher double-fault counts in opening sets. Both sports therefore generate observable statistical clusters that betting models can reference when lines are released.
Conclusion
Recovery windows and travel fatigue patterns produce repeatable shifts in the statistical categories that underpin prop bets across NBA and ATP circuits, and organizations continue to refine data collection on circadian realignment and workload management. As schedules evolve through 2026 and beyond, the integration of flight logs with performance databases offers a structured method for evaluating edges that arise from documented physiological responses rather than from random variance.