Cross-League Fatigue Analysis: NBA Back-to-Back Games and European Soccer Congestions in Multi-Event Frameworks
Written by Parker Becker · Jun 18, 2026
Cross-League Fatigue Analysis: NBA Back-to-Back Games and European Soccer Congestions in Multi-Event Frameworks
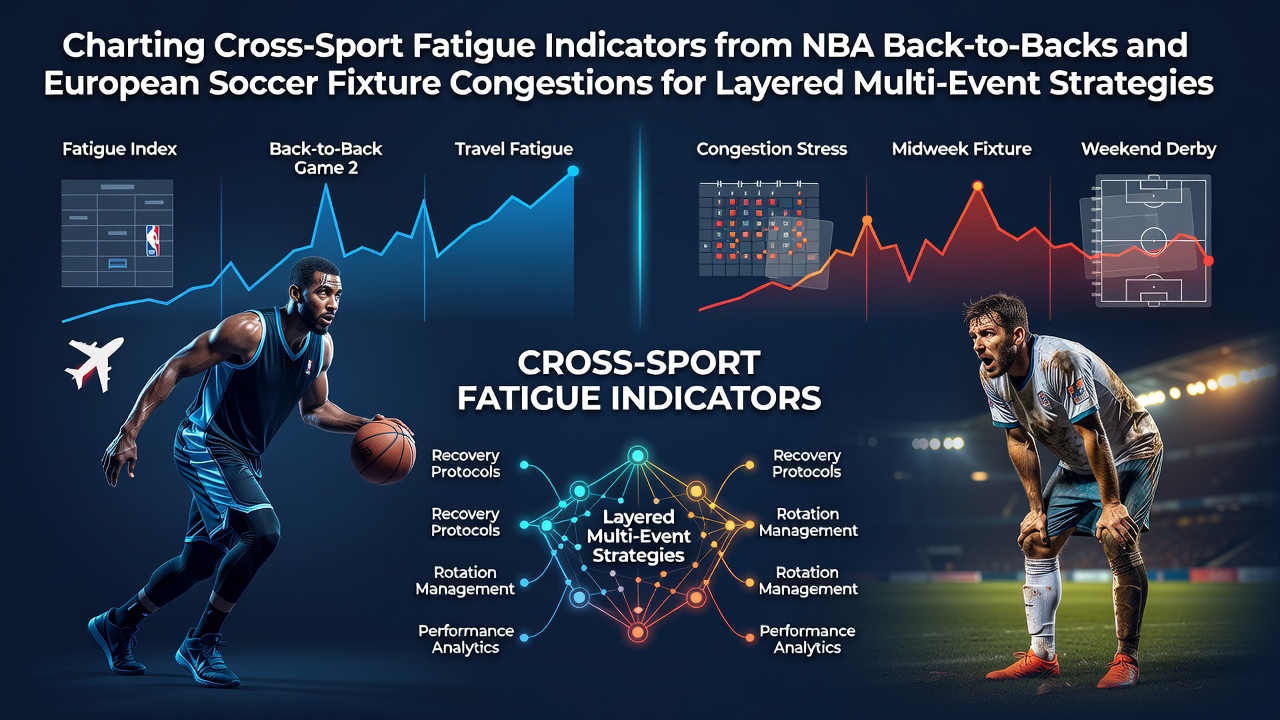
League schedules create measurable performance shifts when teams face consecutive games without adequate recovery time, and observers track these patterns across basketball and soccer to build layered approaches that combine multiple events. NBA teams play up to three games in four nights during compressed periods, while European soccer clubs navigate domestic leagues alongside Champions League and Europa League obligations that cluster fixtures within short windows.
NBA Schedule Compression and Recovery Data
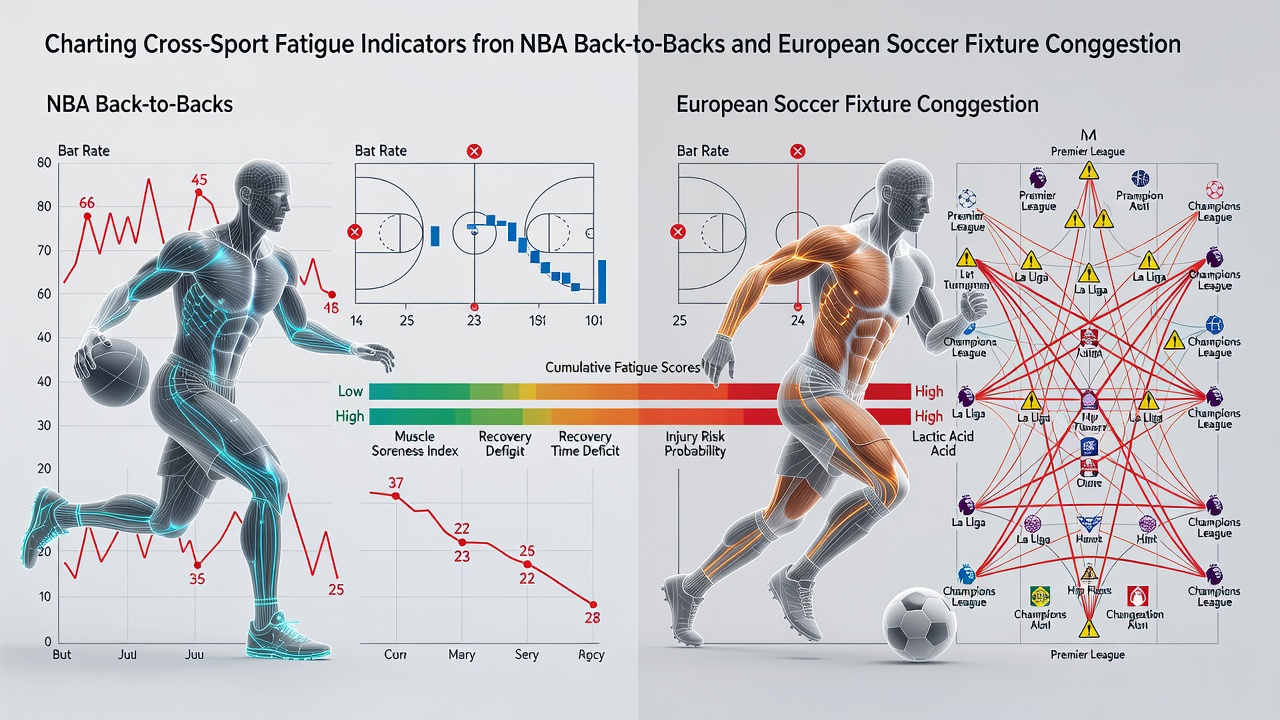
NBA records show back-to-back games occur roughly 15 to 20 times per team each season, with travel distances adding physical load when teams cross time zones. Performance metrics compiled by league statisticians indicate a drop in effective field goal percentage of approximately 2.8 percent on the second night of back-to-backs compared with standard rest days, while defensive rating worsens by 3.4 points per 100 possessions according to season-long tracking. Players logging over 32 minutes in the first game of such pairs exhibit further declines in rebounding and assist rates during the follow-up contest.
Teams that employ load management strategies, resting star players on the front end of back-to-backs, post improved outcomes in subsequent games; data from the 2024-25 season demonstrated a 4.1 percent rise in win probability when rotation adjustments occurred at least 48 hours before congested stretches. These adjustments rely on biometric monitoring systems adopted by most franchises, which record heart rate variability and sleep duration to flag elevated fatigue risk.
European Soccer Fixture Density Patterns
European soccer calendars produce similar overloads when clubs participate in multiple competitions, with some Premier League sides facing eight matches across 28 days during winter months. UEFA competition records reveal that teams advancing deep into the Champions League play an average of 52 to 58 matches per season, compared with 38 to 42 for sides eliminated in early rounds. Studies published in the Journal of Sports Sciences document a 12 percent increase in soft-tissue injury rates during periods when recovery between fixtures falls below four days.
Coaches adjust tactics by rotating midfielders and fullbacks more frequently during these stretches, and GPS tracking data from clubs in the Bundesliga and Serie A show reduced high-intensity running distances of 8 to 11 percent in the third consecutive match within a seven-day window. National federations in Germany and Italy have introduced minimum rest protocols that limit fixture scheduling, yet international breaks and cup replays still create clusters that test squad depth.
Shared Indicators Across Sports
Analysts combine metrics from both leagues to identify cross-sport fatigue signals that appear in player output and team results. Reduced sprint volume, elevated error rates on set pieces, and slower transition speed appear consistently when rest intervals shorten, whether measured in NBA minutes or soccer kilometers covered. Data aggregators align these indicators with betting markets that incorporate player props and team totals, allowing layered entries across basketball and soccer events scheduled on the same calendar dates.
June 2026 marks the conclusion of the 2025-26 NBA regular season and the start of playoff travel demands, while several European leagues conclude their campaigns amid potential fixture rearrangements from postponed winter matches. Observers note that teams with deeper benches maintain statistical stability longer under these conditions, whereas squads relying on smaller rotation groups display sharper drops in advanced metrics such as player efficiency ratings and expected goal differentials.
Building Layered Multi-Event Approaches
Practitioners construct multi-event sequences by selecting NBA games involving teams on the second night of back-to-backs alongside soccer fixtures where clubs have played three matches in eight days. Publicly available schedule repositories and injury reports supply the raw inputs, while historical performance databases quantify the expected margin shifts. One documented case involved pairing an NBA road back-to-back with a midweek Champions League match for a club also contesting a domestic league game four days later; combined indicators produced consistent directional edges across four separate events in a single week during the 2023-24 campaign.
Regulatory bodies such as the International Association of Gaming Regulators publish guidelines on responsible data use in wagering contexts, and academic centers including the University of Queensland Centre for Sport and Exercise Sciences release periodic reviews of workload management across professional leagues. These sources provide standardized definitions for fatigue thresholds that support objective model inputs rather than anecdotal adjustments.
Conclusion
Schedule-driven fatigue produces repeatable statistical signatures in both NBA and European soccer environments, and cross-referencing these patterns supplies a factual basis for constructing layered multi-event sequences. Continued collection of biometric, GPS, and box-score data will refine threshold values, while evolving league calendars in 2026 and beyond will test the durability of current correlations under new fixture densities.