Fatigue Across Fixtures: Connecting Soccer Congestion and Basketball Rotation Data in Betting Frameworks
Written by Dana Becker · Jul 14, 2026
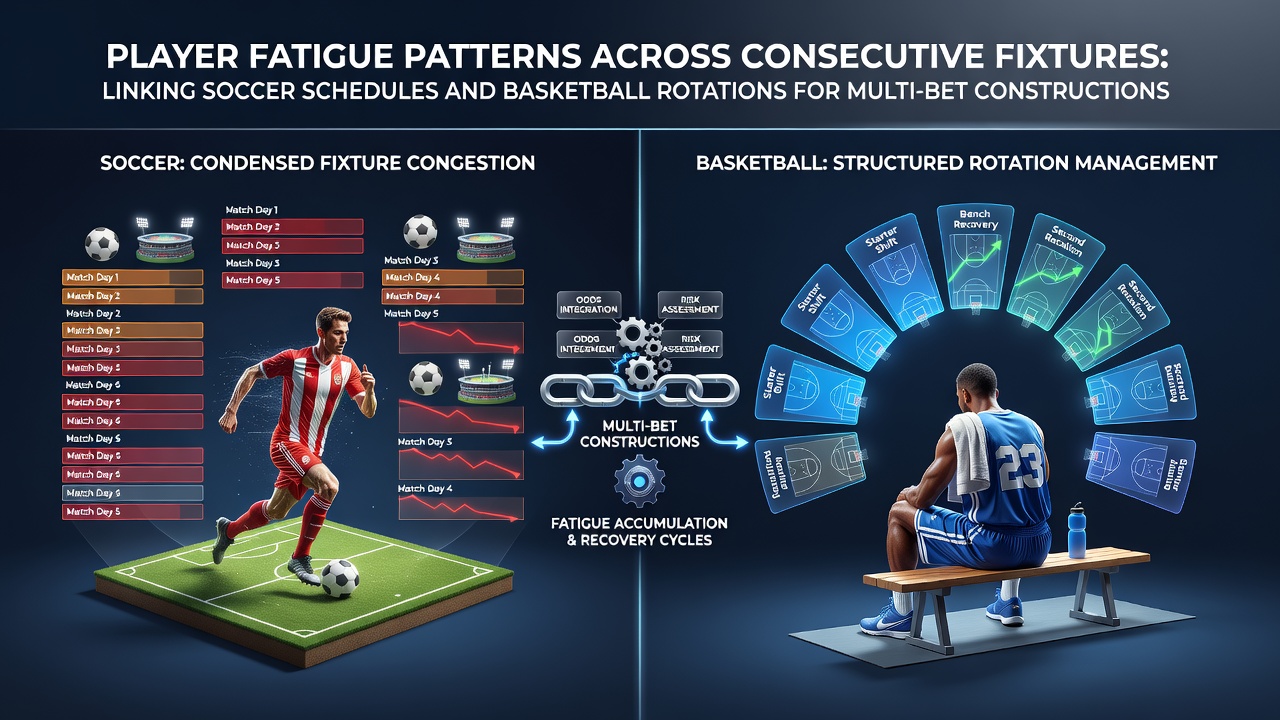
Fatigue Across Fixtures: Connecting Soccer Congestion and Basketball Rotation Data in Betting Frameworks
Player fatigue emerges as a measurable factor when teams face packed calendars, and observers note clear patterns in both soccer and basketball that influence performance metrics used in multi-bet constructions. Data from major leagues reveals how consecutive fixtures without adequate recovery windows correlate with declines in sprint distance, pass accuracy, and defensive efficiency. Researchers at sports science institutions track these variables through GPS systems and workload monitoring tools, providing objective benchmarks that bettors incorporate when building accumulators across different sports.
Soccer Schedule Congestion and Performance Metrics
European soccer calendars create dense blocks of matches, and figures from the 2025-2026 season show clubs averaging 1.8 fixtures per week during peak periods. Teams competing in domestic leagues plus continental competitions experience recovery intervals as short as 48 hours, which studies link to elevated injury rates and reduced high-intensity running output. Analysts examine post-match data sets that quantify how central midfielders cover 15 percent fewer kilometers after three games in eight days, a trend that directly affects over-under totals and handicap selections in betting markets. One analysis of Premier League and Champions League overlaps demonstrated that squads with fewer than four days between games posted lower expected goal values, offering concrete inputs for accumulator models.
Basketball Rotation Patterns and Workload Distribution
NBA and Euroleague schedules similarly compress player minutes across back-to-back games, and rotation data from the 2025-2026 campaign indicates starters average 32 minutes when teams play on consecutive nights versus 36 minutes on standard rest. League tracking systems record declines in shooting percentages and defensive rating after such stretches, with teams resting key players more frequently during the second game of a back-to-back. Observers note that coaches adjust lineups by reducing starter minutes by 8-10 percent on average, shifting production to bench units and altering team totals in prop bet constructions. Academic reviews of player tracking data confirm these adjustments produce measurable drops in points per possession when rotations expand beyond typical thresholds.
Linking Fatigue Data Across Sports for Multi-Bet Strategies
Cross-sport correlations appear when fatigue indicators from soccer and basketball align within the same betting window, and analysts combine these datasets to construct multi-leg wagers. For instance, a soccer side facing its third fixture in seven days often mirrors the workload stress seen in basketball teams during condensed road trips. Performance databases show parallel reductions in key efficiency stats, allowing bettors to identify overlapping edges in player props and team totals. During July 2026, international tournaments and summer league schedules overlapped with domestic pre-seasons, generating additional data points that researchers used to refine fatigue models across both codes. These models integrate variables such as travel distance, minutes played, and recovery time to forecast outcomes with greater precision.
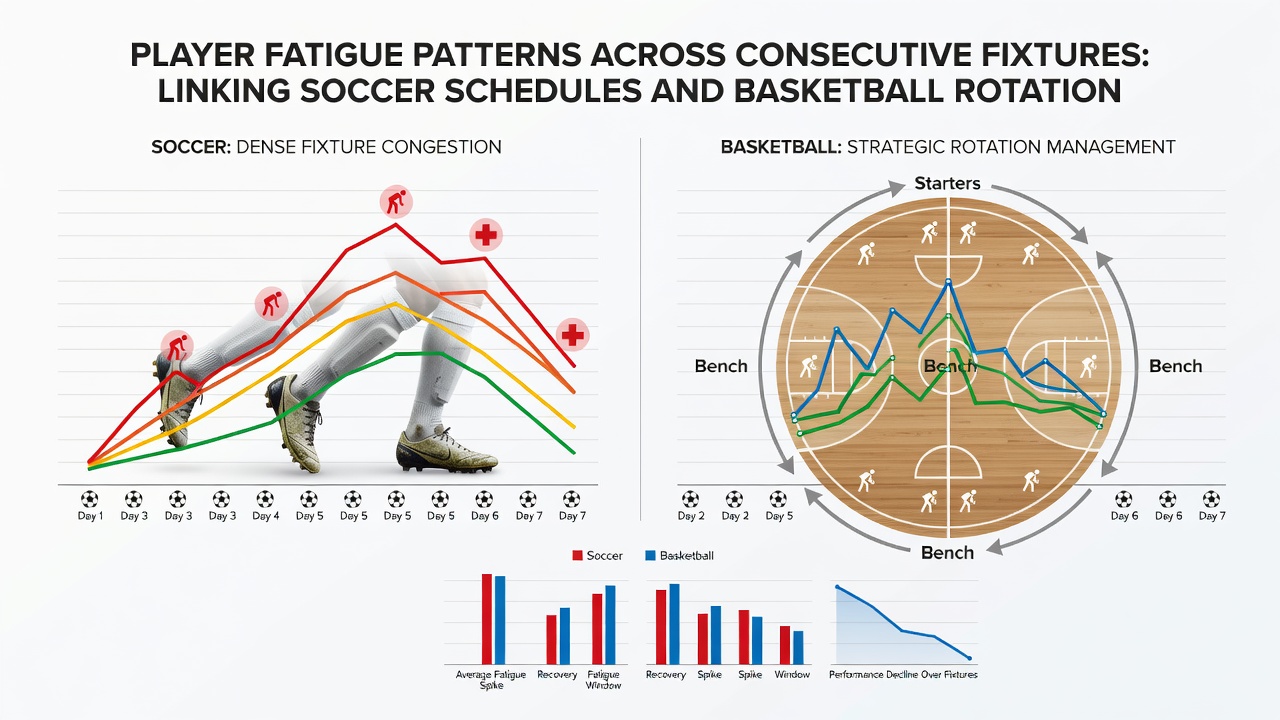
Industry reports from organizations like the NCAA Sports Science Institute and the Aspetar Orthopaedic and Sports Medicine Hospital supply standardized workload metrics that support these linkages. Data sets reveal that soccer players logging over 300 minutes in a 14-day window exhibit similar recovery curves to basketball athletes managing multiple overtime periods across short intervals. Bettors apply these parallels when constructing accumulators that span European soccer matches and NBA summer games, weighting selections toward reduced scoring outputs or elevated foul rates.
Practical Applications in Accumulator Construction
Practitioners build multi-bet structures by layering fatigue-adjusted probabilities rather than raw averages, and this approach produces more stable return profiles across sample sizes. Case examples from the 2025-2026 period include accumulators pairing soccer under totals from congested midweek rounds with basketball player prop unders on usage rate during back-to-backs. Tracking software outputs feed directly into these frameworks, allowing real-time adjustments when schedule changes occur. Those who monitor league-wide injury reports alongside minute distribution charts gain additional confirmation of fatigue trends before finalizing selections.
Conclusion
Objective data on consecutive fixtures demonstrates consistent fatigue effects in soccer schedules and basketball rotations, supplying measurable inputs for multi-bet constructions. Leagues continue releasing performance datasets that refine these connections, and analysts integrate findings from multiple regions to maintain accuracy. Patterns observed through July 2026 highlight how recovery windows shape outcomes across both sports, offering structured information for those constructing accumulators based on workload metrics rather than isolated results.