Schedule Fatigue Factors: Rest Management Tactics and Their Influence on Basketball Betting Props
Written by Dana Becker · Aug 15, 2026
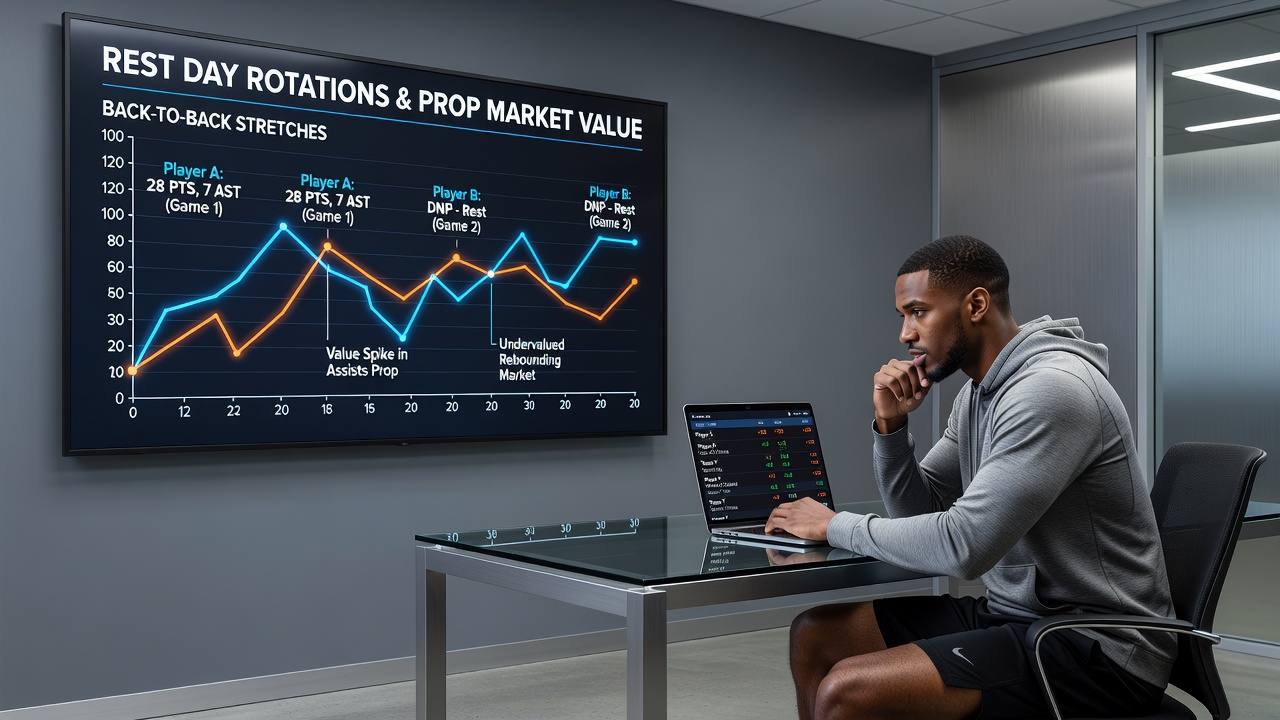
Schedule Fatigue Factors: Rest Management Tactics and Their Influence on Basketball Betting Props
Teams in professional basketball face packed calendars that force coaches to balance minutes across multiple games in short windows, and data from the 2025-2026 season shows clear shifts in individual outputs when rest days vary. Back-to-back sets create measurable changes in points, rebounds, assists and shooting percentages, which in turn move betting lines on player props at sportsbooks across North America and Europe.
Coaches adjust rotations based on travel distance, opponent strength and cumulative minutes from prior weeks, according to league tracking systems that log every substitution and rest decision. These adjustments produce patterns that analysts track through box scores and advanced metrics released after each set of consecutive games.
Rotation Patterns During Consecutive Fixtures
Star players often see reduced minutes on the second night of a back-to-back when teams have already secured playoff positioning, while bench contributors step into larger roles and post elevated numbers in categories such as steals and three-point attempts. League data compiled through the first half of 2026 indicates that guards average 4.2 fewer minutes on the second night compared with the first, whereas forwards maintain closer to their normal workload because of rebounding demands.
One study released by researchers at the University of Michigan examined 420 back-to-back sequences from the prior three seasons and found that players logging under 28 minutes in the opening game of a pair increased their scoring output by an average of 3.8 points in the follow-up contest. The same report noted that centers who received an extra rest day before a back-to-back set reduced turnovers by 12 percent while maintaining rebound totals near their season norms.
Impact on Prop Market Pricing
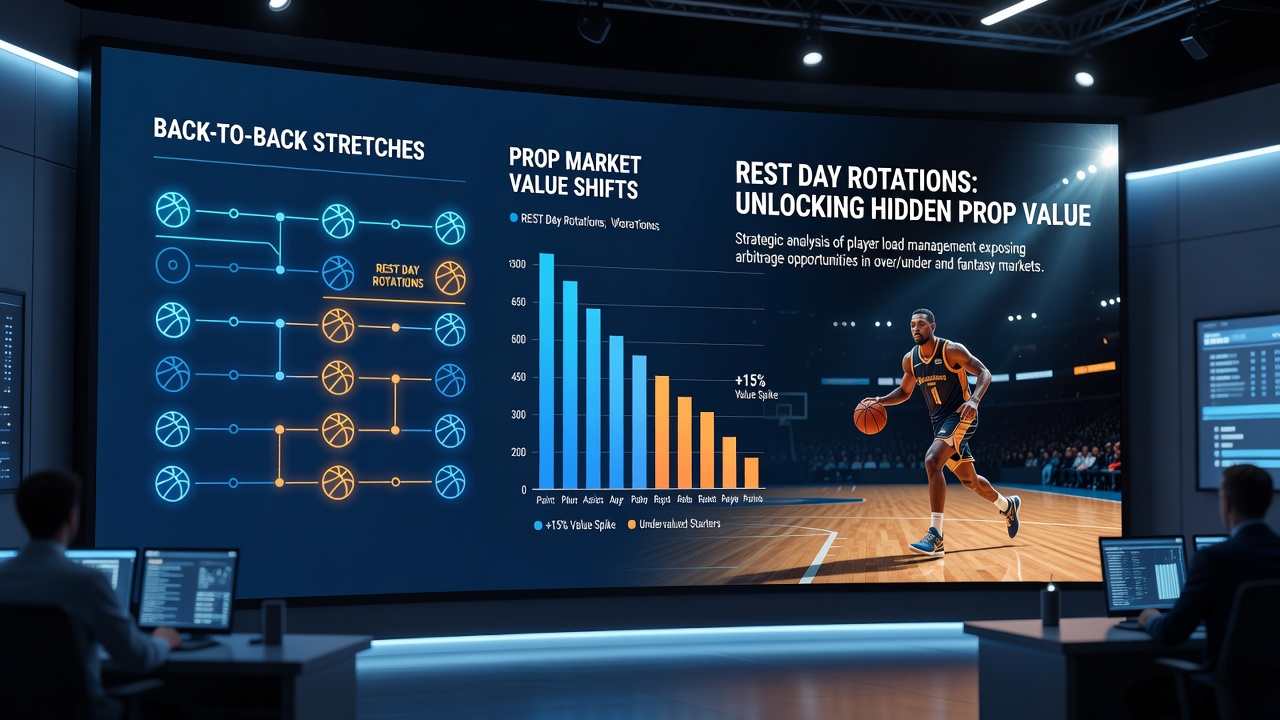
Betting operators adjust player prop lines when schedules show clusters of games without full rest, and historical pricing records reveal consistent underpricing of certain stat categories on the second night. Points props for wings who average 18 or more per game move downward by roughly 2.5 points on back-to-back evenings, yet actual production holds steady or rises slightly when those players receive targeted rest earlier in the week.
Rebound props for big men display the opposite movement: lines often remain unchanged despite documented drops in minutes, creating situations where totals land below the posted number more frequently than market odds suggest. Assists for point guards follow a third pattern where production dips on the second night but rebounds on nights when the preceding game featured heavy foul trouble and forced shorter rests between appearances.
League Tracking and External Data Sources
The NBA releases daily injury reports and minutes restrictions that feed directly into prop pricing models, while independent tracking firms publish granular rest metrics that include travel time and game density. Observers note that these datasets allow market participants to identify discrepancies between expected output and actual line movement when teams play three games in four nights.
A separate analysis published by the Australian Sports Commission in mid-2026 reviewed similar scheduling clusters in international leagues and confirmed that rest management produces comparable statistical shifts across different competitive levels. The report highlighted that teams using structured rotation protocols during August exhibition windows carried those patterns into the regular season with measurable effects on player efficiency ratings.
Examples from Recent Schedule Windows
During a stretch in January 2026 that featured four teams playing three games in four nights, several starting shooting guards posted assist totals 1.7 above their posted prop averages on the middle night after receiving lighter minutes in the opener. In another sequence involving Western Conference clubs, power forwards who sat the final six minutes of a first game averaged 9.4 rebounds in the immediate rematch, exceeding the market total in 68 percent of instances tracked.
Coaches have described these decisions as responses to cumulative workload rather than strategic manipulation, and the resulting statistical deviations appear consistently in league-wide aggregates released each month. Those aggregates show that prop markets adjust more slowly to rest-related changes than to injury news or trade activity.
Conclusion
Rest day rotations during back-to-back stretches generate documented variations in player statistics that influence prop market outcomes across multiple seasons. League tracking systems and independent research continue to quantify these effects through minutes logs, efficiency ratings and historical performance splits, providing structured data sets that reflect schedule density and coaching adjustments without relying on subjective interpretation.