Seasonal Scoring Fluctuations and Accumulator Building in Diverse Athletic Competitions
Written by Rosa Sullivan · Aug 22, 2026
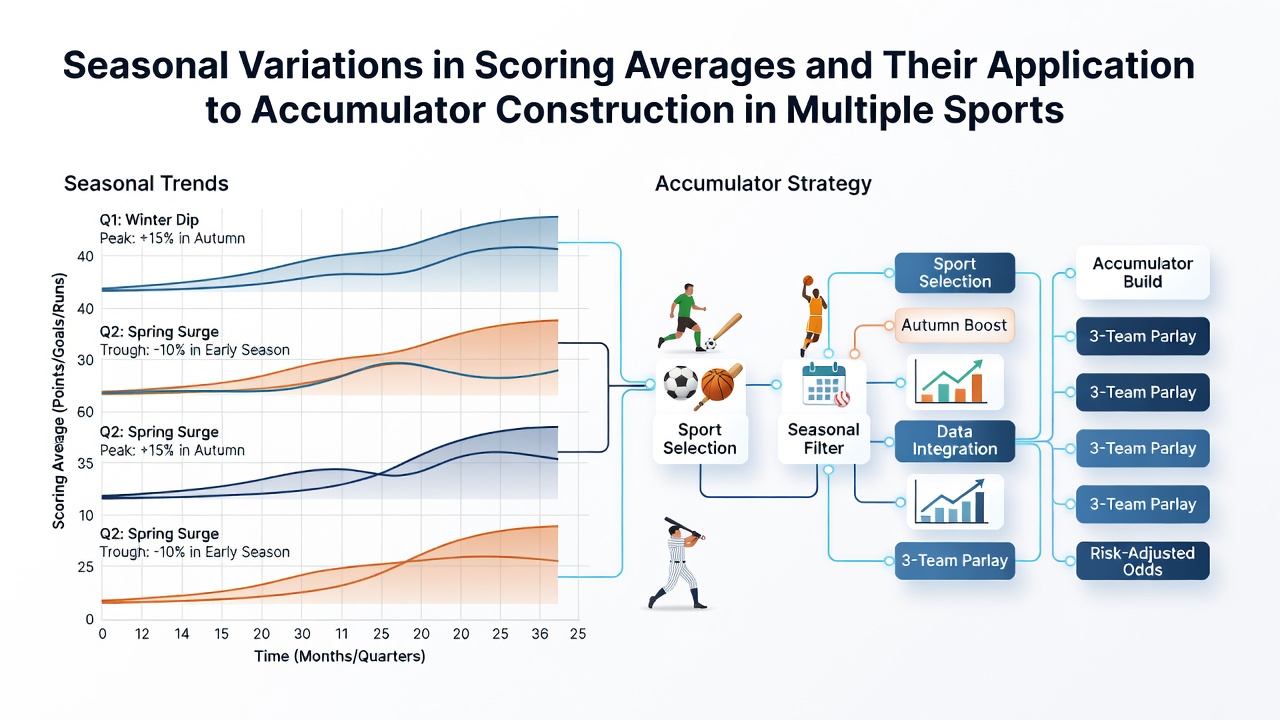
Seasonal Scoring Fluctuations and Accumulator Building in Diverse Athletic Competitions
Professional sports leagues release detailed performance statistics each year, and analysts track how scoring averages shift across different months and phases of competition. In the NBA, for instance, teams post higher points per game during the early regular season months of October through December, while totals often decline in March and April as travel demands increase and injuries accumulate. Similar patterns appear in European soccer, where goal outputs rise in August and September before settling into lower averages during the winter schedule, according to data compiled by league statisticians.
Key Factors Driving Monthly and Quarterly Changes
Weather plays a measurable role in outdoor sports, with colder temperatures correlating to reduced offensive production in both American football and baseball. Researchers at the University of Waterloo have documented how wind speeds above 15 kilometers per hour lower passing efficiency in Canadian Football League games played after mid-October. Schedule congestion also matters, as teams that compete on consecutive nights in the NHL see their average goals per game drop by roughly 0.3 compared with games following a full day of rest. Fatigue compounds across long seasons, yet certain divisions maintain steadier scoring because of divisional matchups that feature familiar defensive schemes.
Indoor sports reveal different rhythms. Basketball leagues show elevated three-point attempt rates in the first half of the season, while late-season contests shift toward higher foul rates and lower field-goal percentages. Tennis tournaments follow surface-based cycles rather than calendar seasons, yet scoring through service breaks still varies by tournament month, with grass-court events in June producing shorter points on average than clay-court stops in May.
Using Historical Data to Shape Accumulator Selections
Accumulator builders examine these documented patterns when constructing multi-leg bets that span several sports. One common approach pairs NBA overs from November games, when scoring peaks, with soccer unders from December matches in northern Europe, where lower goal totals have been recorded over multiple campaigns. Data from the Australian Sports Commission indicates that rugby league try averages rise measurably in the opening rounds of the NRL season, providing another variable for cross-sport combinations during August windows.
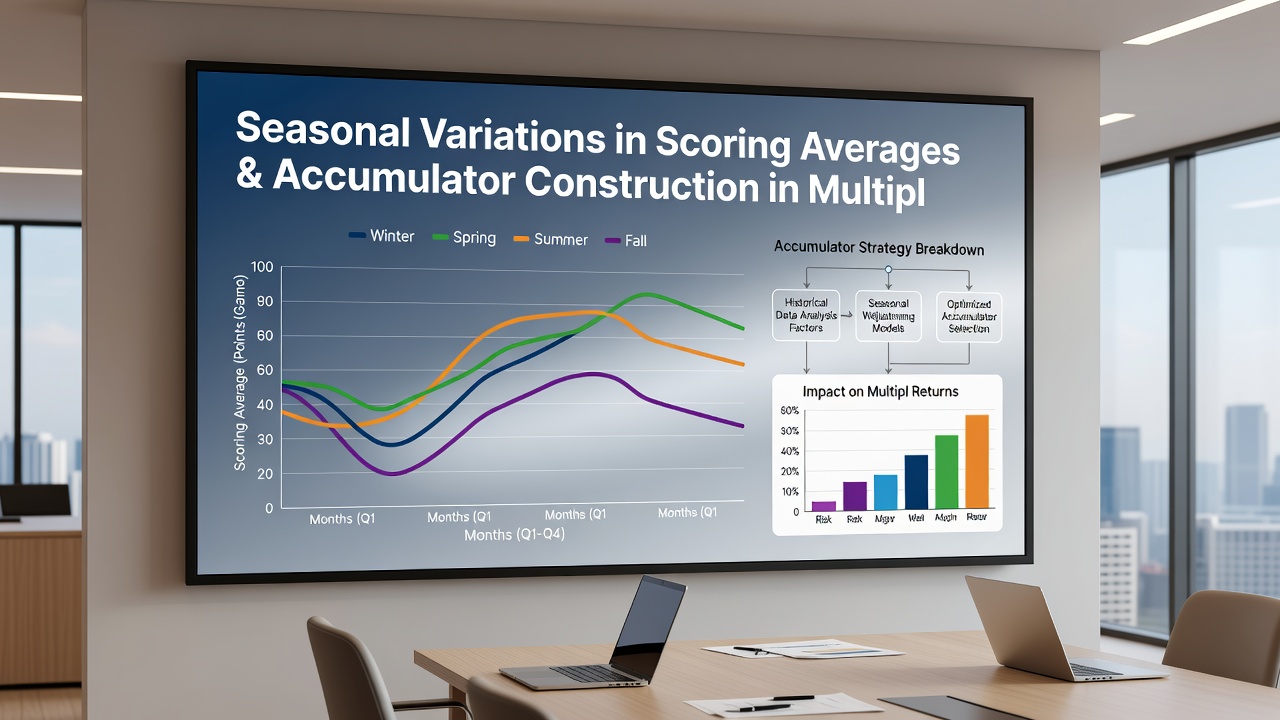
August 2026 marks the start of several major campaigns, including the NBA preseason and the early rounds of European soccer qualifiers. Historical figures show that scoring in these opening fixtures tends to exceed later-season norms, yet defensive structures remain unsettled after off-season roster changes. Accumulator strategies that incorporate early-August overs in basketball and moderate goal totals in soccer have aligned with league averages tracked since 2018. Observers note that baseball run totals also climb during the first two weeks of the MLB schedule before stabilizing once pitching rotations settle into their summer workloads.
League-Specific Examples and Cross-Sport Pairings
The NFL exhibits pronounced scoring spikes in Weeks 1 through 4, when offensive schemes face new defensive coordinators and weather remains mild across most stadiums. By contrast, December and January games produce lower point totals once cold weather arrives and playoff positioning influences conservative play-calling. MLB data reveals that run production climbs in April and May, then dips during the dog days of July and August before a modest rebound in September. These established trends allow parlay constructors to select legs from different leagues that share the same directional bias for a given month.
One documented pairing involves NFL overs in early September combined with NHL unders in late October, when goaltending tends to tighten after the initial adjustment period. Another example links higher-scoring NBA contests in February, during All-Star break recovery weeks, with lower-scoring soccer matches in the same calendar window when European leagues resume after winter breaks. Each combination rests on aggregated box-score data rather than single-game outcomes.
Statistical Tools and Verification Methods
Analysts rely on rolling averages calculated over five-year windows to filter out single-season anomalies. Regression models adjust for variables such as travel distance, rest days, and venue altitude. Public datasets released by leagues allow independent verification of monthly scoring means, and academic papers published in the Journal of Quantitative Analysis in Sports have confirmed the statistical significance of several seasonal effects. Those who apply these models to accumulator construction typically test combinations across at least three sports to reduce the impact of any single league's variance.
Conclusion
Seasonal scoring variations remain measurable across multiple professional leagues, and the patterns supply factual inputs for accumulator construction when builders align legs according to documented monthly or quarterly averages. Continued collection of league statistics will allow ongoing refinement of these approaches as new seasons unfold.